
A well-crafted KPI (key performance indicators) dashboard is like oxygen to anyone who depends on efficiently interpreting marketing metrics. It gives a quick insight on the conversion rates in each stage of the marketing funnel and helps ensure that you are acquiring profitable customers under your CAC goal.
Many companies still manually assemble metrics from different platforms and add them into complicated excel reports. Having one simple dashboard that is updated in real time and synced with all platforms saves tons of time and effort and is simply indispensable. That’s why you should put forth the effort and build an effective dashboard that will deliver the most worthwhile and introspective graphics.
Some of the things to consider looking at in order to create a kickass KPI board:
-
- It measures all the important indicators like DAU, MAU, LTV, Churn, CAC, MRR
- It integrates with Google Analytics, Facebook, Adwords, Hubspot, Salesforce, Intercom, and other marketing tools in use
- It updates your metrics in real time so you can keep track of ongoing changes in your funnel
- It groups together different marketing metrics into an aesthetically pleasing and visually attractive dashboard
We have done a bit of consolidating ourselves, and have put together a list of the best tools to help you build an awesome KPI dashboard you would be proud to put on your office monitor.
1. Cyfe
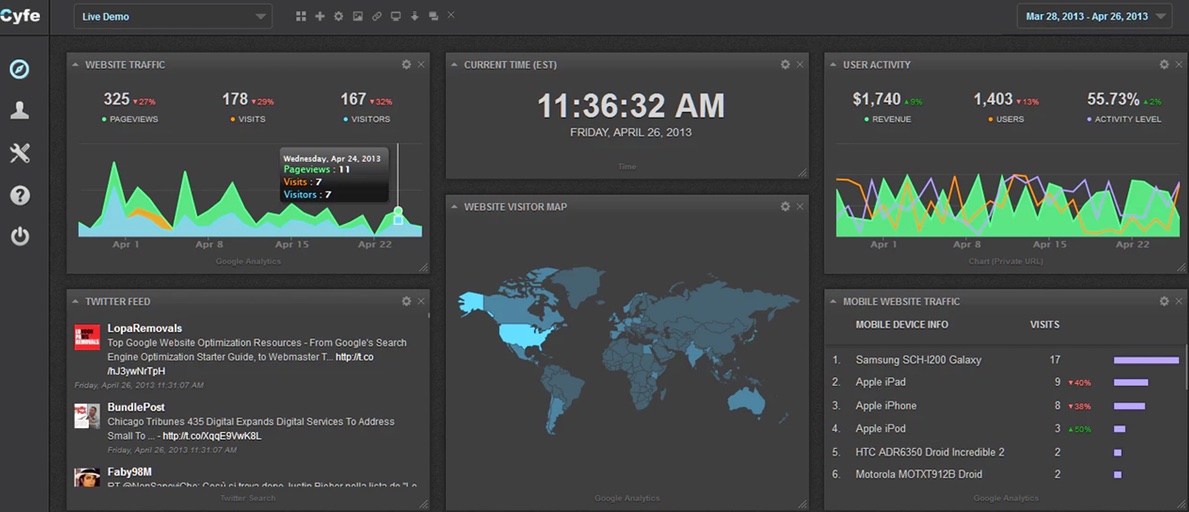
Cyfe is an all-in-one dashboard app that helps users monitor and analyze data scattered across all their online services like Google Analytics and Salesforce. You can use Cyfe to offer intelligent, robust dashboards to your employees and clients, and observe the full picture of your business trends and overall health.
Likes:
- It has re-built widgets that makes integration with other platforms super simple
- Securely display data from company’s database using custom widget or PUSH API
- Contains historical data
- Includes Startup, Social Media, marketing, client, web analytics, finance, sales,
Project management, and IT dashboard.
Dislikes:
- Panel designs could be more varied and visually appealing
Price: $14/month for plans paid annually, $19/month if paid monthly
Special Features: It contains a good amount of data sources, affordable pricing and value for money, top rate customization options for dashboards, CSV and Excel data dashboards, and unlimited users.
2. Grow.com
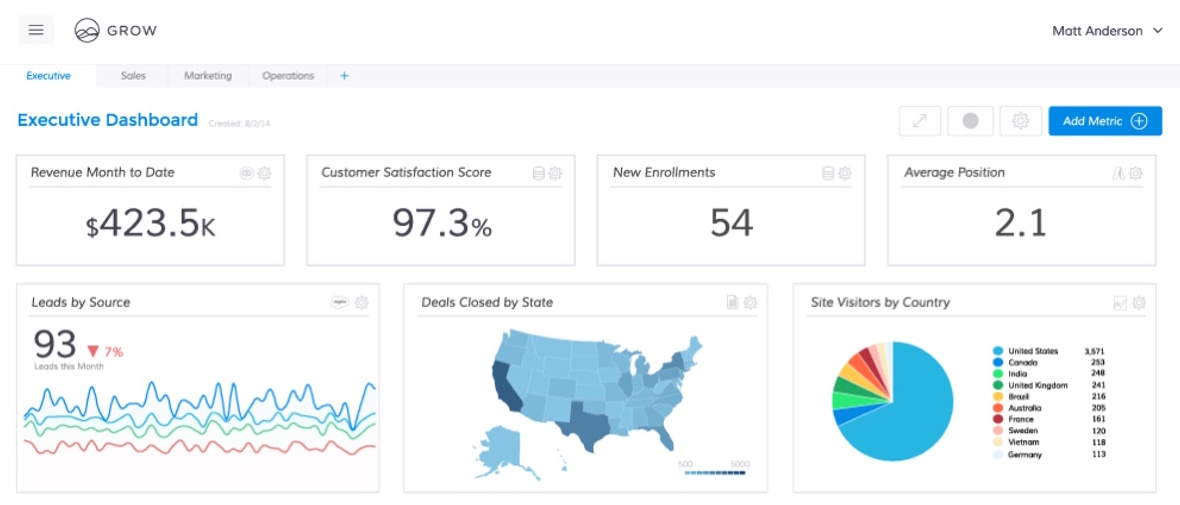
Grow is a business intelligence software that empowers businesses to become data-driven and accelerate growth by aligning team objectives and inspiring strategic decisions. Grow data dashboards are the simplest way to unite data from hundreds of sources, including spreadsheets, databases, and SaaS applications. With Grow’s dashboard software, enterprise-quality data insights are attainable for any business.
Likes:
- Developed for small-medium sized companies
- Real-Time Data
- Information Sharing and Accessibility
- Smart and Intuitive Dashboards
- Fast and Easy Setup
- Connect to Multiple Data Sources
- Quick and Simple Integrations
- SSL Encryption
Dislikes:
- Reports can be complicated with two or more groupings
- A little more expensive than other tools
Price: Custom pricing
Special Features: Grow comes with a vast library of data connections that enables users to create a dashboard in minutes. Only Grow.com provides small businesses a cost-effective system that lets them see all of their key performance indicators (KPIs) in one place by fusing both internal data—from spreadsheets and databases— as well as data from third-party apps like QuickBooks, Salesforce, and Zendesk.
3. Geckoboard
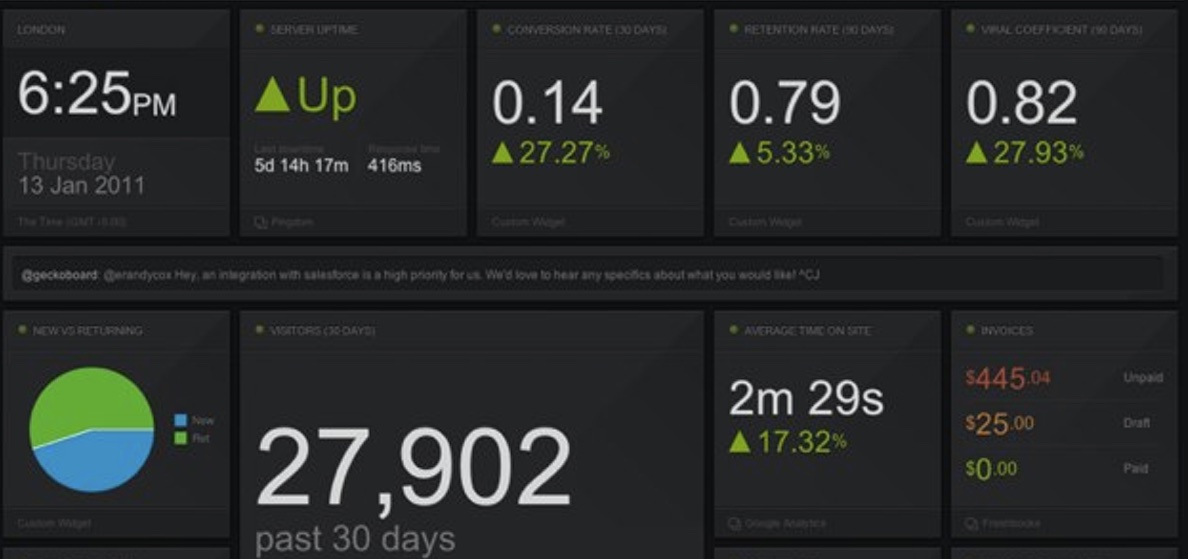
With Geckoboard you can aggregate, visualize and share the key data that drives your business. Pull together data from 80+ different services to build your own custom dashboard that communicates the numbers that matter – beautifully, simply and in real time.
Likes:
- Easy-to-configure dashboard
- Pulls in multiple third-party apps for one comprehensive data overview
- Simple and visually pleasing design
Dislikes:
- Does not directly integrate with Amazon
- No easy setup for beginners
- Drag and drop on dashboard could be easier
Price: Pay monthly, starting at $25/month. One month free when paying annually.
Special Features: Includes modular key performance indicator (KPI) data dashboard, read-only versions, IP address access option, display multiple dashboards, light, dark, and custom Cascading Style Sheets (CSS) themes. It also integrates with 60-plus data tools and accepts proprietary data sources.
4. Kipfolio
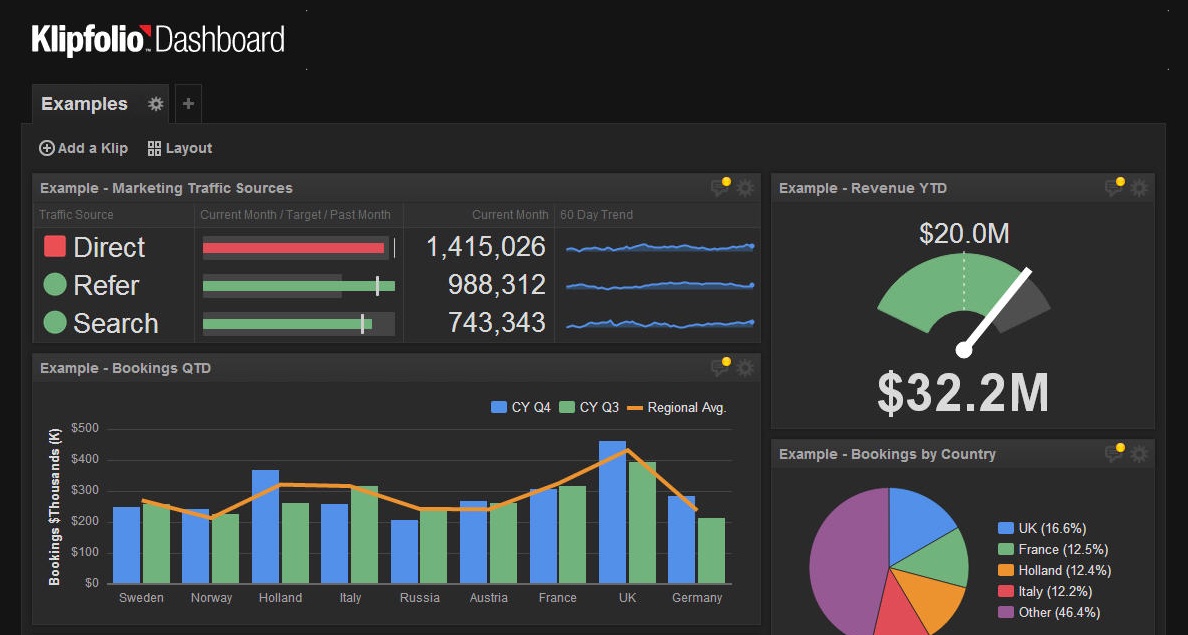
Kipfolio is a cloud app that builds powerful real-time business dashboards. The software is used by a wide variety of businesses, big and small, and by professionals working in a variety of roles, from marketing and sales to BI, consulting and executive management.
Likes:
- Flexibility in look & feel, calculations, and IT connectivity
- Smooth interface for creating new dashboards, tabs, and clips
- Reasonably priced
- Great support team
- Always developing new options and features
Dislikes:
- Easy to get started, but there is a learning curve if you want to go beyond the essentials
- Custom CSS styling options only offered if you pay premium price
- Pricing per account only goes down beyond 10+ users
Price: Starts at $24/month
Special Features: It is 100% cloud-based and allows you to access your data, wherever it is. It also comes with over 300 pre-built metrics and visualizations, has a powerful data visualization editor, can create integrated data mash-ups, and allows for easy sharing.
5. Chart.io
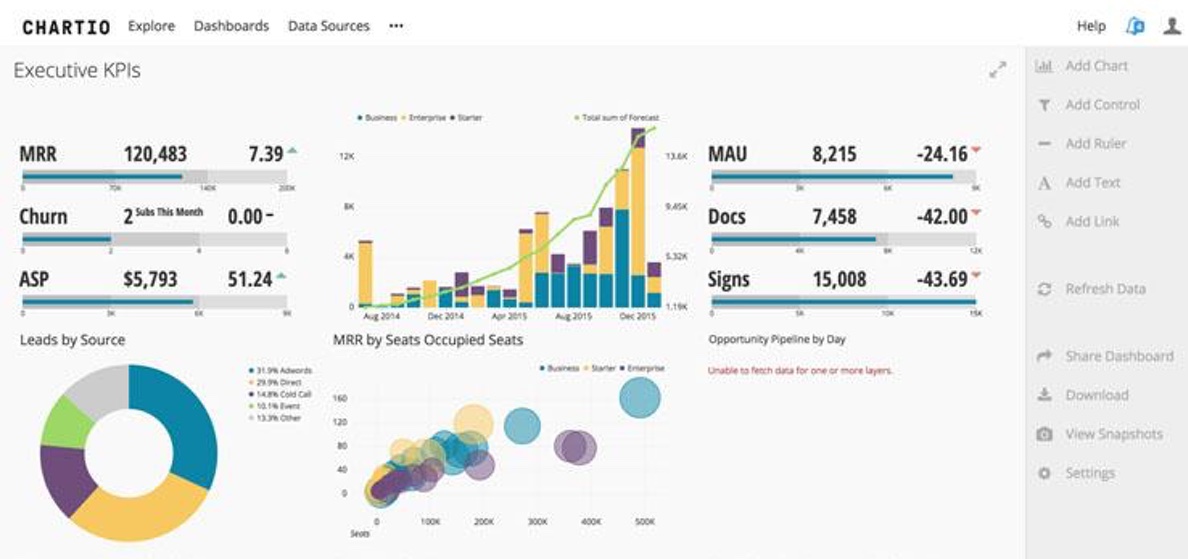
Chartio offers simple and powerful data exploration. It has out-of-the-box connections to your data sources from Amazon Redshift to CSV files, so you can start exploring data immediately. It is built on SQL so there’s no need to learn a proprietary language and deploys a cloud-based application with a few clicks!
Likes:
- Great at optimizing SQL queries
- Contains multiple layers in charts
- Can funnel and organize metrics as you wish
- Consolidates information in visually stunning way
– Offers all different kinds of dashboards
Dislikes:
– User face is not optimally designed
– Can be challenging for beginners
Price: Offers free trial, $2,000 per year per user
Special Features: Users can query data from each data source and combine them together into a single analysis or report. It has an intuitive interface that enables users to query data with its Chart Builder.The data pipeline and data stores features allow users to build and store custom metrics.
6. Google Data Studio
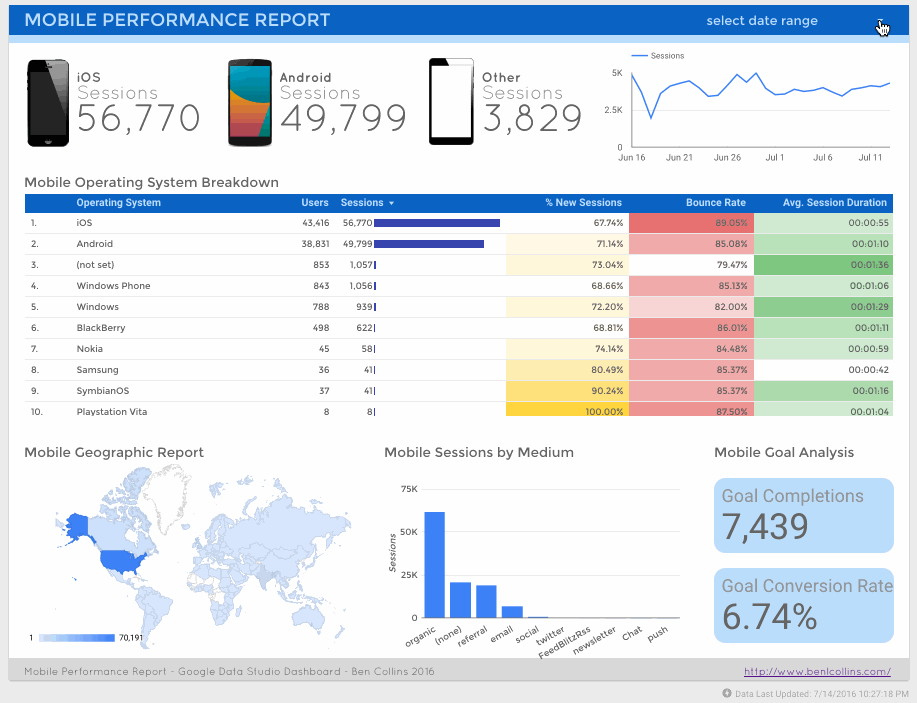
Google Data Studio turns your data into informative dashboards and reports that are easy to read, easy to share, and fully customizable. Dashboarding allows you to tell great data stories to support better business decisions. With Data Studio you can create unlimited custom reports with full editing and sharing.
Likes:
- Can create up to 5 reports for free
- Easy integration with other platforms
- Can add dynamic date range controls to your reports
- Visually simple and pleasing to the eye.
Dislikes:
- Not great at exporting in different files
- Limited number of databases you can connect with
- Easy to use but limited features
Price: Free Public Beta
Special Features: Includes live interactive reports and dashboards, has a TV Ad performance dashboard and allows for you to easily connect all your data.
Of all the dashboard tools we love, our favorite is the CYFE tool. This tool has found a way to succeed on all fronts and offers everything a marketer would want in a KPI Dashboard. It integrates well with other platforms, is visually pleasing, and is being updated in real time. Not to mention, it has a reasonable price.
If there are other tools you think should have made the list, or if you are willing to share your best practices with KPI dashboards, please do it in the comments section below. Looking forward to your input! And don’t forget to check out our top funnel analytics tools list.